
Etiqueta: Data Visualization
-

5 patterns that separate a good dashboard from a memorable one
We’ve figured out why some dashboards tell you right away what to do—and others leave you guessing. The answer lies in five patterns that the best products on the market consistently follow.
-

Creating Context-Aware Notifications for a Better Experience
Learn how different notification types communicate system events, validation, and background tasks while keeping users informed.
-

Cards
Cards are boxes that group together a set of related information.
-
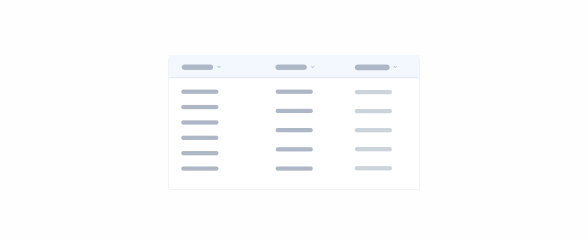
Data Grid v1.2
Data Grids are used to efficiently organize information and make it easier for users to consult it.
-
Data Grid
Data Grids are used to efficiently organize information and make it easier for users to consult it.
-
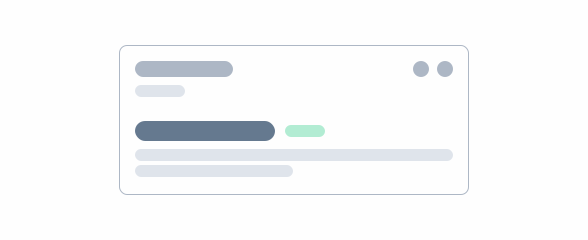
Counter
A counter pattern is a dashboard element that highlights key metrics, offering a quick, clear snapshot of data for fast insights and decision-making.
-
Counter
A counter pattern is a dashboard element that highlights key metrics, offering a quick, clear snapshot of data for fast insights and decision-making.
-
Data Grid
Data Grids are used to efficiently organize information and make it easier for users to consult it.
-

Datagrids Demystified: A Deep Dive into Functionalities
Explore key datagrid functionalities—filters, column grouping, and customization options—and discover how to enhance data management workflows.
-

Fun with flags
Dashboards were not designed to be a rainbow or an epic , but rather the perfect balance between readability, usability and design.